G Mining Ventures Reports Third Quarter 2026 Results – Strong Free Cash Flow Driven by Solid Operational Performance; On Track to Achieve 2026 Production and Cost Guidance
G Mining Ventures Reports Third Quarter 2026 Results – Strong Free Cash Flow Driven by Solid Operational Performance; On Track to Achieve 2026 Production and Cost Guidance
BROSSARD, QUÉBEC, Nov. 12, 2026 (GLOBE NEWSWIRE) -- G Mining Ventures Corp. (“GMIN” or the “Corporation”) (TSX: GMIN, OTCQX: GMINF) today reported financial and operating results for the third quarter ended September 30, 2026. Unless otherwise indicated, all dollar amounts are in U.S. dollars.
Louis-Pierre Gignac, President and Chief Executive Officer, commented: “TZ continues to perform well and remain closely aligned with the operating plan, reflecting the consistent execution of our team. Solid operational performance contributed to strong free cash flow, funding construction activities at Oko. We expect a further increase in throughput, mining rates, as well as higher grades, which will drive a significant increase in production in the fourth quarter, at lower costs, and remain on track to achieve our annual production and cost guidance.“We are making excellent progress across our project pipeline. At Oko, construction continues to advance on schedule and on budget, keeping us firmly on the path toward first gold pour in the second half of 2027. At Gurupi, the ESIA continues to progress and an updated MRE is expected to be complete before year-end, which will form the basis of a Preliminary Economic Assessment (“PEA”) targeted by the end of 2026.”
Third Quarter 2026 Highlights
Solid operational quarter driven by strong execution and cost control - Tocantinzinho (“TZ”) delivered gold production of 44,960 ounces in the third quarter, a 22% increase over the second quarter of 2026 driven by higher grade from mine sequencing, higher throughput and recoveries. Total cash costs of $960 per ounce sold were 8% lower than the second quarter, and All-In Sustaining Costs (“AISC”) of $1,591 per ounce sold were 6% lower than the second quarter, largely driven by higher production. We continue to expect full-year cost to finish within our guidance range despite industry-wide inflationary pressures, which reflects our strong cost discipline.
Strong quarterly free cash flow generation - Solid operational performance together with continued strength in the gold price has translated into strong financial performance. The Corporation reported quarterly net income of $99.5 million or $0.36 per basic share and adjusted net income of $88.8 million or $0.32 per basic share. Cash provided by operating activities before net change in working capital totaled $114.8 million, while free cash flow reached $80.0 million.
Annual gold production tracking to midpoint of guidance range; total cash costs and AISC annual guidance reiterated - Gold production is expected to increase in the fourth quarter, driven by a full-quarter contribution of higher-grade Phase 2 ore. As such, full-year production is tracking to the midpoint of the guided range of 160,000 to 190,000 ounces of gold for 2026. Full-year total cash costs per ounce and AISC per ounce guidance for 2026 remains unchanged at $836 to $965 and $1,330 to $1,544, respectively. Total capital expenditures guidance for 2026 (excluding capitalized exploration) remains unchanged at $583 to $649 million. Capitalized exploration is expected to be approximately $11 million above previous guidance for 2026 of $42 to $50 million due to the infill program launched in the third quarter to advance the integration of the Oko-Ghanie deposits into the expanded Oko Gold Project located in Guyana (“Oko Gold”). Further details are set out in the outlook section below.
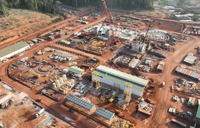
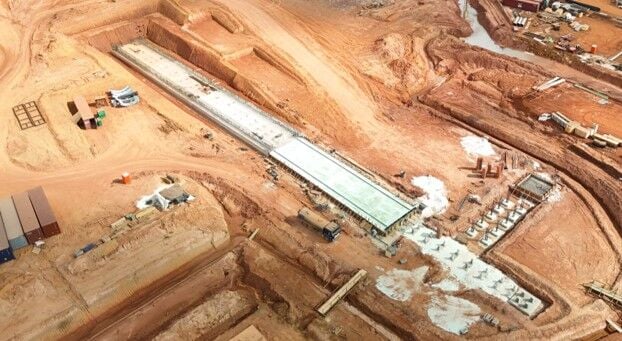
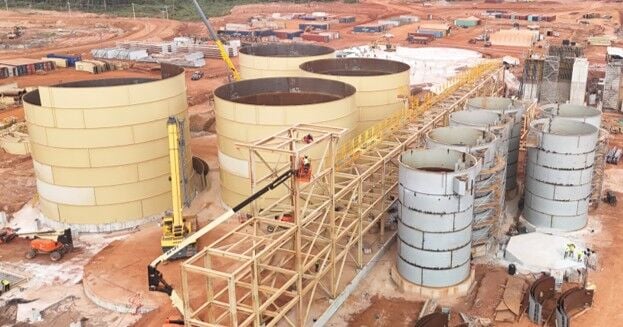
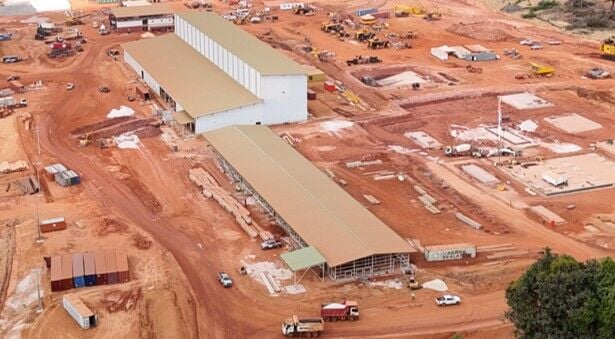
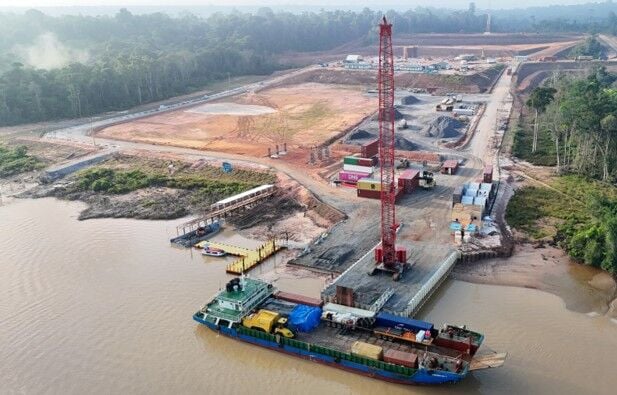
Oko Gold construction continues to progress on-budget and on-schedule for first gold pour in the second half of 2027 - As of September 30, 2026, $556 million had been spent on the Project, representing 57% of the approved initial capital budget of approximately $973 million, with approximately $417 million remaining to be spent through completion. Total commitments reached approximately $714 million, or 73% of the approved capital budget.
Share repurchases – On August 28, 2026, the Toronto Stock Exchange (“TSX”) has accepted the Corporation’s notice of intention to launch a normal course issuer bid (“NCIB”). During the third quarter of 2026, GMIN repurchased and cancelled 102,500 common shares for $3.6 million (C$5.1 million), at an average price of C$49.41 per share. GMIN believes the NCIB offers flexibility to deploy cash strategically in line with its capital allocation priorities and market conditions, while preserving the financial capacity to invest in future growth.
Strong balance sheet maintained through heavy growth capital expenditures – As of September 30, 2026, cash and cash equivalents totaled $137.0 million and long-term debt was $31.2 million, resulting in a net cash position of $105.8 million.
Overview of Financial and Operating Highlights
Production: TZ produced 44,960 ounces of gold in the third quarter of 2026, 3% lower than the prior year period and a 22% increase from the previous quarter. Mining rates increased to average a record of 74,209 tpd in the third quarter, 35% higher than the prior year period and a 7% increase from the previous quarter. Milling rates averaged a new quarterly record of 12,372 tpd during the third quarter, a 4% increase from the prior year period and an 11% increase over the second quarter. Grades processed averaged 1.33 g/t Au during the third quarter, slightly below the prior year period but increased by 8% over the second quarter. Mill recoveries averaged 92.0% in the third quarter, in line with expectations. Gold production is expected to increase in the fourth quarter, driven by a full-quarter contribution of higher-grade Phase 2 ore.
Costs: Total cash costs of $960 per ounce sold and AISC of $1,591 per ounce sold in the third quarter of 2026 were higher than the prior-year period due primarily to lower production volumes, higher royalties, and a stronger Brazilian real relative to the U.S. dollar. In addition, AISC was impacted by higher sustaining capital expenditures and higher general and administrative expenses. For the first nine months of the year, total cash costs of $1,010 per ounce sold and AISC of $1,622 per ounce sold were higher than the prior year period, driven by the same factors. Total cash costs and AISC are expected to decrease in the fourth quarter bringing full year costs in line with annual guidance.
Capital Expenditures: Sustaining capital expenditures at TZ in the third quarter 2026 were $14.8 million, focused on the existing Tailings Storage Facility (“TSF”) dam raise, additional mining equipment and plant enhancements. In the third quarter of 2026, development capital expenditures at Oko Gold were $132.8 million and capitalized exploration expenditures were $16.2 million. For the first nine months of 2026, TZ sustaining capital expenditures were $27.6 million, Oko Gold development capital expenditures were $352.7 million and capitalized exploration were $30.0 million.
Revenue: For the three and nine months ended September 30, 2026, the Corporation sold 43,110 oz and 114,325 oz at an average realized gold price of $4,007/oz and $4,109/oz respectively, contributing to revenues of $172.7 million and $469.8 million, respectively. Differences between gold ounces produced and gold ounces sold are primarily due to shipment and refining timing differences.
Net Income and Adjusted Net Income: Third quarter 2026 net income was $99.5 million ($0.36 per share) compared to net income of $72.0 million ($0.30 per share) in the second quarter of 2026. Adjusted net income was $88.8 million ($0.32 per share). Adjusted net income includes the following adjustments for the third quarter: $(9.3) million related to the change in fair value of financial instruments and $(1.1) million related to the present value adjustment of value added taxes receivable.
Adjusted Earnings Before Interest, Taxes, Depreciation and Amortization (“EBITDA”): Adjusted EBITDA increased when compared to the prior-year period primarily due to higher revenues from mining operations (higher realized gold prices, partially offset by lower gold sales), partially offset by higher production costs (higher labour costs, royalty costs and energy costs).
Cash Provided by Operating Activities: Cash provided by operating activities of $46.0 million in the third quarter of 2026 decreased when compared to the prior-year period and second quarter of 2026, primarily as a result of a $57.1 million cash outflow during the quarter related to the changes in operating assets and liabilities subsequently to the acquisition of G2 Goldfields Inc. (“G2 acquisition”). Cash provided by operating activities before changes in working capital was $114.8 million, an increase of 7% when compared to the prior-year period and an increase of 9% when compared to the second quarter of 2026.
Financial and Operating Highlights
(In thousands of $ except as noted)
Three Months Ended September 30,
Nine Months Ended September 30,
2026
2025
2026
2025
Financial Results
Revenue
172,730
161,718
469,793
389,330
Cost of Goods Sold
57,471
45,879
161,350
128,329
Income from Mining Operations
115,259
115,839
308,443
261,001
Net Income
99,498
123,789
251,825
196,844
Adjusted Net Income
88,790
114,124
229,983
185,601
Adjusted EBITDA
125,632
122,566
337,031
283,552
Cash Provided by Operating Activities Before theNet Change in Working Capital Items
114,768
107,334
291,128
218,343
Cash Provided by Operating Activities
45,954
101,283
219,495
211,574
Capital Expenditures (Sustaining)
22,959
12,155
55,556
36,443
Capital Expenditures (Growth)
132,832
-
352,676
-
Capital Expenditures (Capitalized Exploration)
16,218
1,482
29,955
8,232
Free Cash Flow
80,046
89,128
220,990
175,131
Net Income per Common Share
0.36
0.55
1.01
0.87
Adjusted Net Incomeper Common Share
0.32
0.50
0.92
0.82
Per Ounce Data
Average Realized Gold Price($/oz)
4,007
3,292
4,109
3,124
Average Gold Price Received($/oz)
3,830
3,114
4,014
2,916
Total Cash Costs per Ounce of Gold Sold
960
721
1,010
726
AISC per Ounce of Gold Sold
1,591
1,046
1,622
1,121
Operating Results
Gold Produced (oz)
44,960
46,360
113,651
124,525
Gold Sold (oz)
43,110
49,119
114,325
124,636
Mining Activities
Ore Tonnes Mined (kt)
1,966
1,787
4,659
4,948
Waste Tonnes Mined (kt)
4,861
3,275
14,005
8,177
Total Tonnes Mined (kt)
6,827
5,062
18,664
13,125
Waste-to-Ore Ratio
2.47
1.83
3.01
1.65
Average Grade of gold (g Au/t)
0.98
1.18
0.98
1.18
Processing Activities
Tonnes of Ore Processed (kt)
1,138
1,094
3,213
3,009
Tonnes of Ore Processed per Day
12,372
11,890
11,770
11,021
Average Grade of Gold Processed (g Au/t)
1.33
1.43
1.20
1.43
Average Recovery Rate
92.0
%
92.3
%
91.5
%
90.2
%
Outlook Gold production was 113,651 ounces in the first nine months of 2026, which was in line with the mine plan and which contemplated the processing of lower-grade ore in the first half of the year as mining focused on accelerated waste stripping and pit advancement to access higher-grade Phase 2 mineralization. The Corporation remains on track to achieve its 2026 production guidance of 160,000 to 190,000 ounces of gold. Production is expected to increase in the fourth quarter and to be the strongest quarter of the year, driven by increased throughput and ounces by a full-quarter contribution of higher-grade Phase 2 ore.
For the first nine months of the year, total cash costsof $1,010 per ounce sold and AISC of $1,622 per ounce sold were higher than the prior year period, driven by the same factors. Total cash costsand AISCare expected to decrease in the fourth quarter due to higher production and lower operating costs, bringing full year costs in line with annual guidance.
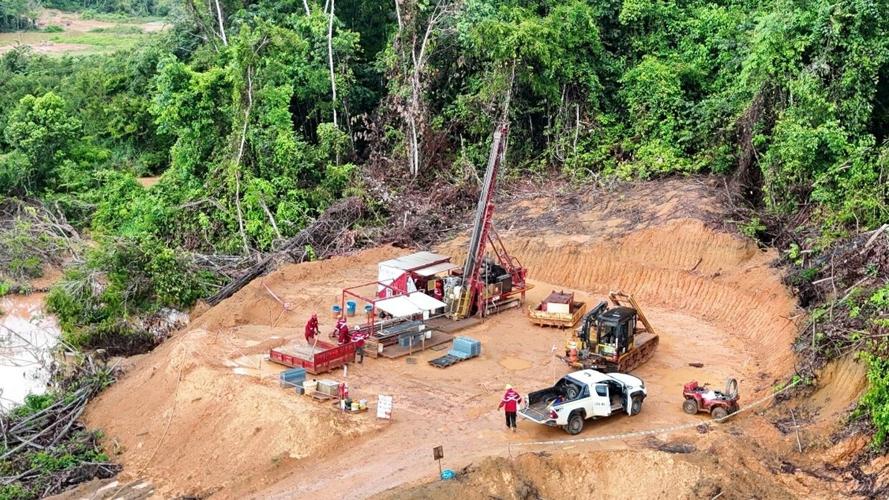
For the first nine months of 2026, sustaining capital expenditures were $27.6 million, Oko Gold development capital expenditures were $352.7 million and capitalized exploration were $30.0 million. Total capital expenditures guidance for 2026 (excluding capitalized exploration) remains unchanged at $583 to $649 million. Exploration capital is expected to be approximately $11 million above guidance for 2026 of $42 to $50 million due to the infill program launched in the third quarter to advance the integration of the Oko-Ghanie deposits into Oko Gold.
Given its strong outlook with significant free cash flow growth expected in the next several years, the Corporation expects to continue to be active in its share buyback while balancing its other capital allocation priorities.
2026 and 2027 Guidance
Operational & Cost Guidance
Q3 2026 YTDActuals
2026Guidance
2027Guidance
In millions of $, except as otherwise noted
Gold Production
k oz
114
160 - 190
200 - 235
Total Cash Costs
$/oz Au
1,010
836 – 965
633 - 743
Site-Level AISC
$/oz Au
1,501
1,233 - 1,430
898 - 1,054
AISC
$/oz Au
1,622
1,330 - 1,544
977 - 1,146
Sustaining Capital Expenditures
Sustaining
$
27
38 - 45
19 – 23
Capitalized Stripping
$
26
31 - 36
43 – 51
Exploration (Sustaining)
$
2
-
-
Total Sustaining Capital Expenditures
$
55
69 - 81
62 – 74
Non-Sustaining Capital Expenditures
TZ Exploration
$
4
8 - 10
8 - 10
Oko Gold Exploration
$
14
26-28was 15-17
14 - 18
Gurupi Exploration
$
12
19 - 23
18 - 22
Total Exploration
$
30
53-61
40 - 50
Oko Gold Development
$
353
514 - 568
217 - 240
Total Non-Sustaining Capital Expenditures
$
383
567 - 629
257 - 290
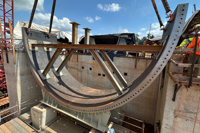
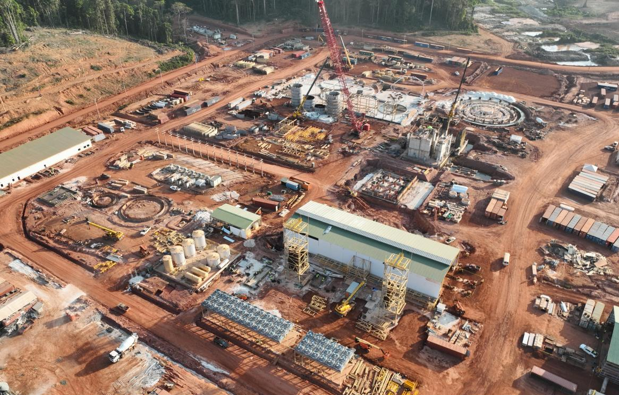
Advancing the Next Phase of Transformational Growth Oko Gold The Corporation continues to rapidly advance its large-scale, long-life Oko Gold Project in Guyana, which remains on-budget and on-schedule for a first gold pour in the second half of 2027. At the end of the third quarter, $556 million was spent on the Project, representing 57% of the approved initial capital budget of $973 million, with approximately $417 million remaining to be spent through completion. Total commitments reached $714 million, or 73% of the approved capital budget. Total capital expenditures guidance at Oko Gold for 2026 and 2027 remain unchanged at $514 to $568 million, and $217 to $240 million respectively.
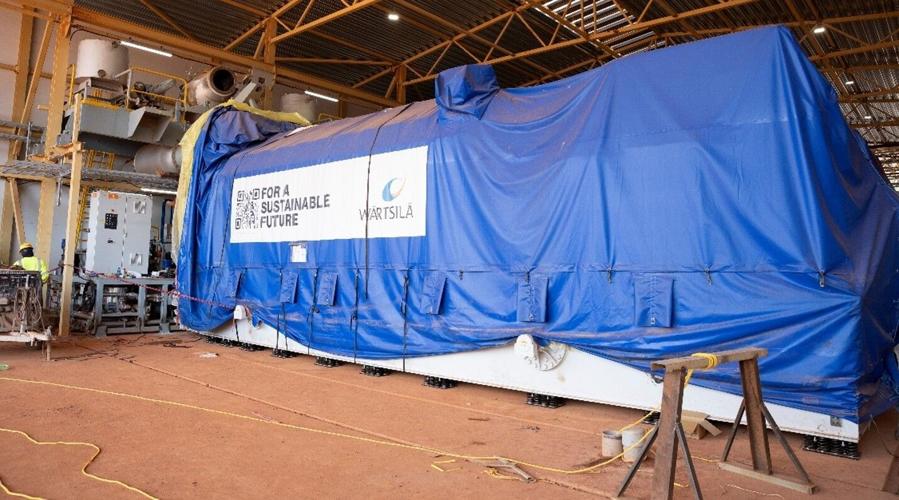
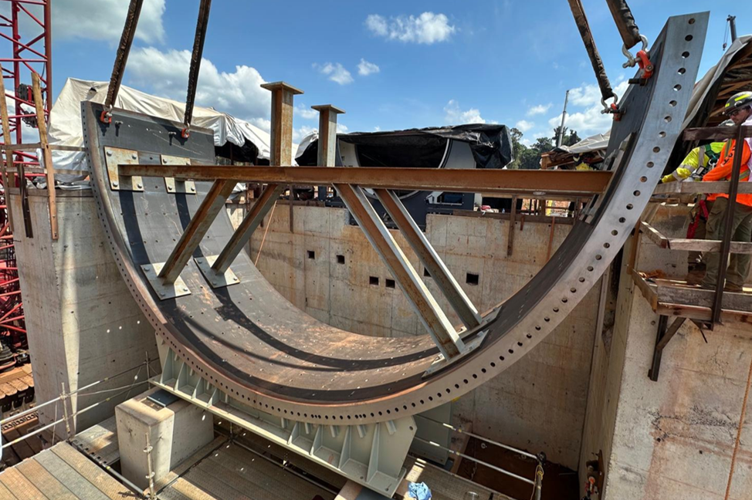
As of September 30, 2026, overall project progress at Oko Gold had reached 38.4% based on earned value, with rapid progress made across several key workstreams summarized below: